20 Tyler Best

-
- Height:
- 6'6
-
- Year:
- FR
-
- Hometown:
- Melbourne, Australia
-
- Position:
- Guard/Forward
-
- gp
- 31
-
- pts/g
- 13.4
-
- fg %
- 47.7
-
- 3pt %
- 41.8
-
- ft %
- 74.0
-
- reb/g
- 5.3
-
- a/g
- 1.9
Recent Games
| Total | Conference | |
|---|---|---|
| Games | 31 | 22 |
| Games started | 31 | 22 |
| Minutes | 849 | 646 |
| Minutes per game | 27.4 | 29.4 |
| FG | 143-300 | 107-225 |
| FG Pct | 47.7 | 47.6 |
| 3PT | 76-182 | 59-139 |
| 3PT Pct | 41.8 | 42.4 |
| FT | 54-73 | 38-52 |
| FT Pct | 74.0 | 73.1 |
| Off rebounds | 26 | 21 |
| Def rebounds | 137 | 94 |
| Total rebounds | 163 | 115 |
| Rebounds per game | 5.3 | 5.2 |
| Personal fouls | 54 | 40 |
| Disqualifications | - | - |
| Assists | 59 | 43 |
| Turnovers | 48 | 24 |
| Assist to turnover ratio | 1.2 | 1.8 |
| Steals | 24 | 23 |
| Blocks | 5 | 4 |
| Points | 416 | 311 |
| Points per game | 13.4 | 14.1 |
| Points per 40 min | 19.6 | 19.3 |
Game Log - Shooting
| Date | Opponent | Score | gs | min | fg | pct | 3pt | pct | ft | pct | pts |
|---|---|---|---|---|---|---|---|---|---|---|---|
| Oct 19 | Williston State College | - | - | - | - | - | - | - | - | - | |
| Oct 21 | Dakota College at Bottineau | - | - | - | - | - | - | - | - | - | |
| Nov 3 | vs. United Tribes Technical College | L, 81-68 | 1 | 29 | 3-7 | 42.9 | 1-4 | 25.0 | 2-2 | 100.0 | 9 |
| Nov 4 | vs. Miles Community College | L, 2-0 | 1 | 30 | 7-15 | 46.7 | 6-14 | 42.9 | 6-6 | 100.0 | 26 |
| Nov 5 | vs. Lake Region State College - ND | L, 89-75 | 1 | 23 | 2-7 | 28.6 | 2-6 | 33.3 | 4-4 | 100.0 | 10 |
| Nov 10 | Mayville State JV | W, 69-61 | 1 | 24 | 0-3 | 0.0 | 0-2 | 0.0 | 2-2 | 100.0 | 2 |
| Nov 11 | Rocky Mountain JV | W, 117-102 | 1 | 20 | 8-11 | 72.7 | 0-2 | 0.0 | 5-7 | 71.4 | 21 |
| Nov 17 | Western Iowa Tech | L, 86-68 | 1 | 22 | 4-7 | 57.1 | 2-4 | 50.0 | 0-0 | - | 10 |
| Nov 18 | vs. Minnesota North College-Hibbing | W, 102-88 | 1 | 22 | 7-10 | 70.0 | 4-6 | 66.7 | 3-3 | 100.0 | 21 |
| Nov 26 | Bismarck State College | W, 90-84 | 1 | 24 | 4-6 | 66.7 | 4-5 | 80.0 | 3-4 | 75.0 | 15 |
| Nov 30 | Dawson Community College | L, 100-75 | 1 | 22 | 2-6 | 33.3 | 1-3 | 33.3 | 0-1 | 0.0 | 5 |
| Dec 3 | at North Dakota State College of Science | L, 72-50 | 1 | 25 | 5-9 | 55.6 | 2-6 | 33.3 | 0-0 | - | 12 |
| Dec 4 | at Dakota College at Bottineau | L, 100-87 | 1 | 31 | 7-11 | 63.6 | 4-5 | 80.0 | 1-2 | 50.0 | 19 |
| Dec 7 | vs. Western Nebraska Community College | L, 84-65 | 1 | 19 | 3-7 | 42.9 | 2-4 | 50.0 | 0-0 | - | 8 |
| Dec 8 | vs. Casper College | L, 97-68 | 1 | 20 | 4-7 | 57.1 | 1-4 | 25.0 | 1-1 | 100.0 | 10 |
| Dec 9 | at Gillette College | L, 104-65 | 1 | 24 | 2-8 | 25.0 | 2-5 | 40.0 | 0-0 | - | 6 |
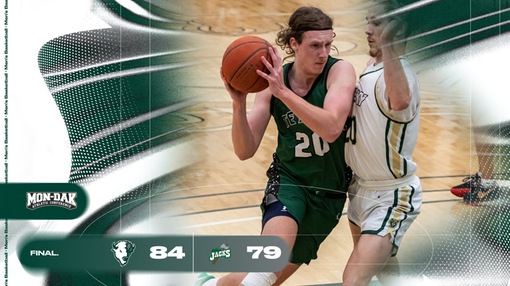
| Dec 15 | at South Mountain Community College | W, 84-79 | 1 | 26 | 4-10 | 40.0 | 3-8 | 37.5 | 2-4 | 50.0 | 13 |
| Dec 17 | at Chandler-Gilbert Community College | L, 90-64 | 1 | 26 | 4-12 | 33.3 | 3-8 | 37.5 | 3-4 | 75.0 | 14 |
| Jan 10 | Dakota College at Bottineau | L, 87-72 | 1 | 17 | 4-8 | 50.0 | 1-3 | 33.3 | 2-3 | 66.7 | 11 |
| Jan 18 | Bismarck State College | L, 81-73 | 1 | 28 | 5-12 | 41.7 | 4-7 | 57.1 | 0-0 | - | 14 |
| Jan 21 | Dawson Community College | L, 86-80 | 1 | 25 | 3-12 | 25.0 | 1-7 | 14.3 | 0-1 | 0.0 | 7 |
| Jan 25 | at Miles Community College | W, 82-73 | 1 | 31 | 5-15 | 33.3 | 2-8 | 25.0 | 3-4 | 75.0 | 15 |
| Jan 28 | at Lake Region State College - ND | W, 79-75 | 1 | 35 | 9-15 | 60.0 | 4-6 | 66.7 | 7-9 | 77.8 | 29 |
| Jan 31 | North Dakota State College of Science | L, 87-56 | 1 | 27 | 4-12 | 33.3 | 1-6 | 16.7 | 2-2 | 100.0 | 11 |
| Feb 1 | United Tribes Technical College | W, 82-71 | 1 | 24 | 3-10 | 30.0 | 0-5 | 0.0 | 1-2 | 50.0 | 7 |
| Feb 5 | at Bismarck State College | W, 107-97 | 1 | 42 | 7-12 | 58.3 | 3-7 | 42.9 | 0-0 | - | 17 |
| Feb 7 | Lake Region State College - ND | L, 84-83 | 1 | 32 | 6-11 | 54.5 | 4-9 | 44.4 | 3-5 | 60.0 | 19 |
| Feb 12 | Miles Community College | W, 98-88 | 1 | 36 | 6-12 | 50.0 | 2-4 | 50.0 | 2-3 | 66.7 | 16 |
| Feb 15 | at Dawson Community College | L, 82-69 | 1 | 30 | 4-9 | 44.4 | 4-8 | 50.0 | 0-1 | 0.0 | 12 |
| Feb 19 | at United Tribes Technical College | L, 84-80 | 1 | 33 | 7-10 | 70.0 | 4-7 | 57.1 | 2-3 | 66.7 | 20 |
| Feb 22 | at North Dakota State College of Science | L, 91-63 | 1 | 31 | 3-6 | 50.0 | 2-4 | 50.0 | 0-0 | - | 8 |
| Feb 25 | at Dakota College at Bottineau | W, 84-79 | 1 | 38 | 7-12 | 58.3 | 5-10 | 50.0 | 0-0 | - | 19 |
| Feb 28 | Bismarck State College | L, 89-74 | 1 | 33 | 4-8 | 50.0 | 2-5 | 40.0 | 0-0 | - | 10 |
Game Log - Ball control
| Date | Opponent | Score | gs | min | off | def | reb | ast | to | stl | blk |
|---|---|---|---|---|---|---|---|---|---|---|---|
| Oct 19 | Williston State College | - | - | - | - | - | - | - | - | - | |
| Oct 21 | Dakota College at Bottineau | - | - | - | - | - | - | - | - | - | |
| Nov 3 | vs. United Tribes Technical College | L, 81-68 | 1 | 29 | 0 | 4 | 4 | 1 | 2 | 1 | 0 |
| Nov 4 | vs. Miles Community College | L, 2-0 | 1 | 30 | 0 | 4 | 4 | 0 | 2 | 2 | 1 |
| Nov 5 | vs. Lake Region State College - ND | L, 89-75 | 1 | 23 | 0 | 4 | 4 | 1 | 2 | 1 | 0 |
| Nov 10 | Mayville State JV | W, 69-61 | 1 | 24 | 1 | 10 | 11 | 1 | 3 | 0 | 0 |
| Nov 11 | Rocky Mountain JV | W, 117-102 | 1 | 20 | 1 | 10 | 11 | 1 | 1 | 0 | 0 |
| Nov 17 | Western Iowa Tech | L, 86-68 | 1 | 22 | 0 | 1 | 1 | 1 | 4 | 1 | 0 |
| Nov 18 | vs. Minnesota North College-Hibbing | W, 102-88 | 1 | 22 | 2 | 3 | 5 | 1 | 3 | 0 | 0 |
| Nov 26 | Bismarck State College | W, 90-84 | 1 | 24 | 1 | 3 | 4 | 6 | 0 | 1 | 1 |
| Nov 30 | Dawson Community College | L, 100-75 | 1 | 22 | 1 | 2 | 3 | 2 | 2 | 0 | 0 |
| Dec 3 | at North Dakota State College of Science | L, 72-50 | 1 | 25 | 1 | 3 | 4 | 1 | 1 | 2 | 0 |
| Dec 4 | at Dakota College at Bottineau | L, 100-87 | 1 | 31 | 1 | 7 | 8 | 1 | 0 | 0 | 0 |
| Dec 7 | vs. Western Nebraska Community College | L, 84-65 | 1 | 19 | 1 | 4 | 5 | 2 | 4 | 0 | 0 |
| Dec 8 | vs. Casper College | L, 97-68 | 1 | 20 | 0 | 4 | 4 | 5 | 2 | 0 | 0 |
| Dec 9 | at Gillette College | L, 104-65 | 1 | 24 | 0 | 2 | 2 | 1 | 3 | 0 | 0 |
| Dec 15 | at South Mountain Community College | W, 84-79 | 1 | 26 | 0 | 4 | 4 | 3 | 3 | 0 | 0 |
| Dec 17 | at Chandler-Gilbert Community College | L, 90-64 | 1 | 26 | 0 | 5 | 5 | 1 | 1 | 0 | 1 |
| Jan 10 | Dakota College at Bottineau | L, 87-72 | 1 | 17 | 0 | 3 | 3 | 1 | 2 | 0 | 0 |
| Jan 18 | Bismarck State College | L, 81-73 | 1 | 28 | 2 | 2 | 4 | 0 | 0 | 0 | 0 |
| Jan 21 | Dawson Community College | L, 86-80 | 1 | 25 | 3 | 2 | 5 | 4 | 2 | 3 | 0 |
| Jan 25 | at Miles Community College | W, 82-73 | 1 | 31 | 1 | 6 | 7 | 1 | 1 | 3 | 0 |
| Jan 28 | at Lake Region State College - ND | W, 79-75 | 1 | 35 | 1 | 8 | 9 | 3 | 1 | 0 | 0 |
| Jan 31 | North Dakota State College of Science | L, 87-56 | 1 | 27 | 2 | 1 | 3 | 2 | 0 | 1 | 0 |
| Feb 1 | United Tribes Technical College | W, 82-71 | 1 | 24 | 2 | 8 | 10 | 3 | 0 | 1 | 1 |
| Feb 5 | at Bismarck State College | W, 107-97 | 1 | 42 | 1 | 6 | 7 | 2 | 2 | 2 | 0 |
| Feb 7 | Lake Region State College - ND | L, 84-83 | 1 | 32 | 1 | 6 | 7 | 2 | 3 | 1 | 0 |
| Feb 12 | Miles Community College | W, 98-88 | 1 | 36 | 3 | 11 | 14 | 4 | 0 | 3 | 0 |
| Feb 15 | at Dawson Community College | L, 82-69 | 1 | 30 | 0 | 1 | 1 | 2 | 1 | 1 | 0 |
| Feb 19 | at United Tribes Technical College | L, 84-80 | 1 | 33 | 1 | 4 | 5 | 5 | 0 | 0 | 0 |
| Feb 22 | at North Dakota State College of Science | L, 91-63 | 1 | 31 | 0 | 5 | 5 | 0 | 3 | 0 | 1 |
| Feb 25 | at Dakota College at Bottineau | W, 84-79 | 1 | 38 | 0 | 2 | 2 | 1 | 0 | 0 | 0 |
| Feb 28 | Bismarck State College | L, 89-74 | 1 | 33 | 0 | 2 | 2 | 1 | 0 | 1 | 0 |
Game Log - Ball control extended
| Date | Opponent | Score | gs | pf | dq | a/to |
|---|---|---|---|---|---|---|
| Oct 19 | Williston State College | - | - | - | - | |
| Oct 21 | Dakota College at Bottineau | - | - | - | - | |
| Nov 3 | vs. United Tribes Technical College | L, 81-68 | 1 | 2 | - | 0.5 |
| Nov 4 | vs. Miles Community College | L, 2-0 | 1 | 0 | - | 0.0 |
| Nov 5 | vs. Lake Region State College - ND | L, 89-75 | 1 | 3 | - | 0.5 |
| Nov 10 | Mayville State JV | W, 69-61 | 1 | 2 | - | 0.3 |
| Nov 11 | Rocky Mountain JV | W, 117-102 | 1 | 1 | - | 1.0 |
| Nov 17 | Western Iowa Tech | L, 86-68 | 1 | 3 | - | 0.3 |
| Nov 18 | vs. Minnesota North College-Hibbing | W, 102-88 | 1 | 3 | - | 0.3 |
| Nov 26 | Bismarck State College | W, 90-84 | 1 | 0 | - | - |
| Nov 30 | Dawson Community College | L, 100-75 | 1 | 1 | - | 1.0 |
| Dec 3 | at North Dakota State College of Science | L, 72-50 | 1 | 5 | - | 1.0 |
| Dec 4 | at Dakota College at Bottineau | L, 100-87 | 1 | 2 | - | - |
| Dec 7 | vs. Western Nebraska Community College | L, 84-65 | 1 | 0 | - | 0.5 |
| Dec 8 | vs. Casper College | L, 97-68 | 1 | 0 | - | 2.5 |
| Dec 9 | at Gillette College | L, 104-65 | 1 | 1 | - | 0.3 |
| Dec 15 | at South Mountain Community College | W, 84-79 | 1 | 2 | - | 1.0 |
| Dec 17 | at Chandler-Gilbert Community College | L, 90-64 | 1 | 2 | - | 1.0 |
| Jan 10 | Dakota College at Bottineau | L, 87-72 | 1 | 1 | - | 0.5 |
| Jan 18 | Bismarck State College | L, 81-73 | 1 | 1 | - | - |
| Jan 21 | Dawson Community College | L, 86-80 | 1 | 2 | - | 2.0 |
| Jan 25 | at Miles Community College | W, 82-73 | 1 | 3 | - | 1.0 |
| Jan 28 | at Lake Region State College - ND | W, 79-75 | 1 | 3 | - | 3.0 |
| Jan 31 | North Dakota State College of Science | L, 87-56 | 1 | 0 | - | - |
| Feb 1 | United Tribes Technical College | W, 82-71 | 1 | 1 | - | - |
| Feb 5 | at Bismarck State College | W, 107-97 | 1 | 3 | - | 1.0 |
| Feb 7 | Lake Region State College - ND | L, 84-83 | 1 | 3 | - | 0.7 |
| Feb 12 | Miles Community College | W, 98-88 | 1 | 1 | - | - |
| Feb 15 | at Dawson Community College | L, 82-69 | 1 | 1 | - | 2.0 |
| Feb 19 | at United Tribes Technical College | L, 84-80 | 1 | 0 | - | - |
| Feb 22 | at North Dakota State College of Science | L, 91-63 | 1 | 3 | - | 0.0 |
| Feb 25 | at Dakota College at Bottineau | W, 84-79 | 1 | 1 | - | - |
| Feb 28 | Bismarck State College | L, 89-74 | 1 | 4 | - | - |
Career Stats - Shooting per game
| gp | min/g | fg/g | 3pt/g | ft/g | ppg | |
|---|---|---|---|---|---|---|
| 2023-24 | 31 | 27.4 | 4.6-9.7 | 2.5-5.9 | 1.7-2.4 | 13.4 |
| Total | 31 | 27.4 | 4.6-9.7 | 2.5-5.9 | 1.7-2.4 | 13.4 |
Career Stats - Shooting totals
| gp | gs | min | fg | pct | 3pt | pct | ft | pct | pts | |
|---|---|---|---|---|---|---|---|---|---|---|
| 2023-24 | 31 | 31 | 849 | 143-300 | 47.7 | 76-182 | 41.8 | 54-73 | 74.0 | 416 |
| Total | 31 | 31 | 849 | 143-300 | 47.7 | 76-182 | 41.8 | 54-73 | 74.0 | 416 |
Career Stats - Shooting per 40 min
| gp | min | min/g | fg/40 | 3pt/40 | pct | ft/40 | pts/40 | |
|---|---|---|---|---|---|---|---|---|
| 2023-24 | 31 | 849 | 27.4 | 6.7-14.1 | 3.6-8.6 | 41.8 | 2.5-3.4 | 19.6 |
| Total | 31 | 849 | 27.4 | 6.7-14.1 | 3.6-8.6 | 41.8 | 2.5-3.4 | 19.6 |
Career Stats - Ball control per game
| gp | off/g | def/g | reb/g | ast/g | to/g | stl/g | blk/g | |
|---|---|---|---|---|---|---|---|---|
| 2023-24 | 31 | 0.8 | 4.4 | 5.3 | 1.9 | 1.5 | 0.8 | 0.2 |
| Total | 31 | 0.8 | 4.4 | 5.3 | 1.9 | 1.5 | 0.8 | 0.2 |
Career Stats - Ball control totals
| gp | gs | off | def | reb | ast | to | stl | blk | |
|---|---|---|---|---|---|---|---|---|---|
| 2023-24 | 31 | 31 | 26 | 137 | 163 | 59 | 48 | 24 | 5 |
| Total | 31 | 31 | 26 | 137 | 163 | 59 | 48 | 24 | 5 |
Career Stats - Ball control per 40 min
| gp | off/40 | def/40 | reb/40 | ast/40 | to/40 | stl/40 | blk/40 | |
|---|---|---|---|---|---|---|---|---|
| 2023-24 | 31 | 1.2 | 6.5 | 7.7 | 2.8 | 2.3 | 1.1 | 0.2 |
| Total | 31 | 1.2 | 6.5 | 7.7 | 2.8 | 2.3 | 1.1 | 0.2 |
Splits Stats - Shooting per game
| gp | min/g | fg/g | 3pt/g | ft/g | ppg | |
|---|---|---|---|---|---|---|
| Event | ||||||
| Total | 31 | 27.4 | 4.6-9.7 | 2.5-5.9 | 1.7-2.4 | 13.4 |
| Conference | 22 | 29.4 | 4.9-10.2 | 2.7-6.3 | 1.7-2.4 | 14.1 |
| Exhibition | - | - | 0.0-0.0 | 0.0-0.0 | 0.0-0.0 | - |
| Location | ||||||
| Home | 13 | 25.7 | 4.1-9.1 | 1.7-4.8 | 1.5-2.3 | 11.4 |
| Away | 12 | 31.0 | 5.3-10.8 | 3.2-6.8 | 1.5-2.2 | 15.3 |
| Neutral | 6 | 23.8 | 4.3-8.8 | 2.7-6.3 | 2.7-2.7 | 14.0 |
| Result | ||||||
| Wins | 11 | 29.3 | 5.5-10.5 | 2.5-5.7 | 2.5-3.5 | 15.9 |
| Losses | 20 | 26.3 | 4.2-9.2 | 2.5-6.0 | 1.3-1.8 | 12.1 |
| Month | ||||||
| November | 9 | 24.0 | 4.1-8.0 | 2.2-5.1 | 2.8-3.2 | 13.2 |
| December | 7 | 24.4 | 4.1-9.1 | 2.4-5.7 | 1.0-1.6 | 11.7 |
| January | 6 | 27.2 | 5.0-12.3 | 2.2-6.2 | 2.3-3.2 | 14.5 |
| February | 9 | 33.2 | 5.2-10.0 | 2.9-6.6 | 0.9-1.6 | 14.2 |
Splits Stats - Shooting totals
| gp | gs | min | fg | pct | 3pt | pct | ft | pct | pts | |
|---|---|---|---|---|---|---|---|---|---|---|
| Event | ||||||||||
| Total | 31 | 31 | 849 | 143-300 | 47.7 | 76-182 | 41.8 | 54-73 | 74.0 | 416 |
| Conference | 22 | 22 | 646 | 107-225 | 47.6 | 59-139 | 42.4 | 38-52 | 73.1 | 311 |
| Exhibition | - | - | - | 0-0 | - | 0-0 | - | 0-0 | - | 0 |
| Location | ||||||||||
| Home | 13 | 13 | 334 | 53-118 | 44.9 | 22-62 | 35.5 | 20-30 | 66.7 | 148 |
| Away | 12 | 12 | 372 | 64-129 | 49.6 | 38-82 | 46.3 | 18-27 | 66.7 | 184 |
| Neutral | 6 | 6 | 143 | 26-53 | 49.1 | 16-38 | 42.1 | 16-16 | 100.0 | 84 |
| Result | ||||||||||
| Wins | 11 | 11 | 322 | 60-116 | 51.7 | 27-63 | 42.9 | 28-38 | 73.7 | 175 |
| Losses | 20 | 20 | 527 | 83-184 | 45.1 | 49-119 | 41.2 | 26-35 | 74.3 | 241 |
| Month | ||||||||||
| November | 9 | 9 | 216 | 37-72 | 51.4 | 20-46 | 43.5 | 25-29 | 86.2 | 119 |
| December | 7 | 7 | 171 | 29-64 | 45.3 | 17-40 | 42.5 | 7-11 | 63.6 | 82 |
| January | 6 | 6 | 163 | 30-74 | 40.5 | 13-37 | 35.1 | 14-19 | 73.7 | 87 |
| February | 9 | 9 | 299 | 47-90 | 52.2 | 26-59 | 44.1 | 8-14 | 57.1 | 128 |
Splits Stats - Shooting per 40 min
| gp | min | min/g | fg/40 | 3pt/40 | pct | ft/40 | pts/40 | |
|---|---|---|---|---|---|---|---|---|
| Event | ||||||||
| Total | 31 | 849 | 27.4 | 6.7-14.1 | 3.6-8.6 | 41.8 | 2.5-3.4 | 19.6 |
| Conference | 22 | 646 | 29.4 | 6.6-13.9 | 3.7-8.6 | 42.4 | 2.4-3.2 | 19.3 |
| Exhibition | - | - | - | 0.0-0.0 | 0.0-0.0 | - | 0.0-0.0 | - |
| Location | ||||||||
| Home | 13 | 334 | 25.7 | 6.3-14.1 | 2.6-7.4 | 35.5 | 2.4-3.6 | 17.7 |
| Away | 12 | 372 | 31.0 | 6.9-13.9 | 4.1-8.8 | 46.3 | 1.9-2.9 | 19.8 |
| Neutral | 6 | 143 | 23.8 | 7.3-14.8 | 4.5-10.6 | 42.1 | 4.5-4.5 | 23.5 |
| Result | ||||||||
| Wins | 11 | 322 | 29.3 | 7.4-14.4 | 3.4-7.8 | 42.9 | 3.5-4.7 | 21.7 |
| Losses | 20 | 527 | 26.3 | 6.3-14.0 | 3.7-9.0 | 41.2 | 2.0-2.7 | 18.3 |
| Month | ||||||||
| November | 9 | 216 | 24.0 | 6.9-13.3 | 3.7-8.5 | 43.5 | 4.6-5.4 | 22.0 |
| December | 7 | 171 | 24.4 | 6.8-15.0 | 4.0-9.4 | 42.5 | 1.6-2.6 | 19.2 |
| January | 6 | 163 | 27.2 | 7.3-18.1 | 3.2-9.1 | 35.1 | 3.4-4.7 | 21.3 |
| February | 9 | 299 | 33.2 | 6.3-12.1 | 3.5-7.9 | 44.1 | 1.1-1.9 | 17.1 |
Splits Stats - Ball control per game
| gp | off/g | def/g | reb/g | ast/g | to/g | stl/g | blk/g | |
|---|---|---|---|---|---|---|---|---|
| Event | ||||||||
| Total | 31 | 0.8 | 4.4 | 5.3 | 1.9 | 1.5 | 0.8 | 0.2 |
| Conference | 22 | 1.0 | 4.3 | 5.2 | 2.0 | 1.1 | 1.0 | 0.2 |
| Exhibition | - | - | - | - | - | - | - | - |
| Location | ||||||||
| Home | 13 | 1.3 | 4.7 | 6.0 | 2.2 | 1.3 | 0.9 | 0.2 |
| Away | 12 | 0.5 | 4.4 | 4.9 | 1.8 | 1.3 | 0.7 | 0.2 |
| Neutral | 6 | 0.5 | 3.8 | 4.3 | 1.7 | 2.5 | 0.7 | 0.2 |
| Result | ||||||||
| Wins | 11 | 1.2 | 6.5 | 7.6 | 2.4 | 1.3 | 0.9 | 0.2 |
| Losses | 20 | 0.7 | 3.3 | 4.0 | 1.6 | 1.7 | 0.7 | 0.1 |
| Month | ||||||||
| November | 9 | 0.7 | 4.6 | 5.2 | 1.6 | 2.1 | 0.7 | 0.2 |
| December | 7 | 0.4 | 4.1 | 4.6 | 2.0 | 2.0 | 0.3 | 0.1 |
| January | 6 | 1.5 | 3.7 | 5.2 | 1.8 | 1.0 | 1.2 | 0.0 |
| February | 9 | 0.9 | 5.0 | 5.9 | 2.2 | 1.0 | 1.0 | 0.2 |
Splits Stats - Ball control totals
| gp | gs | off | def | reb | ast | to | stl | blk | |
|---|---|---|---|---|---|---|---|---|---|
| Event | |||||||||
| Total | 31 | 31 | 26 | 137 | 163 | 59 | 48 | 24 | 5 |
| Conference | 22 | 22 | 21 | 94 | 115 | 43 | 24 | 23 | 4 |
| Exhibition | - | - | - | - | - | - | - | - | - |
| Location | |||||||||
| Home | 13 | 13 | 17 | 61 | 78 | 28 | 17 | 12 | 2 |
| Away | 12 | 12 | 6 | 53 | 59 | 21 | 16 | 8 | 2 |
| Neutral | 6 | 6 | 3 | 23 | 26 | 10 | 15 | 4 | 1 |
| Result | |||||||||
| Wins | 11 | 11 | 13 | 71 | 84 | 26 | 14 | 10 | 2 |
| Losses | 20 | 20 | 13 | 66 | 79 | 33 | 34 | 14 | 3 |
| Month | |||||||||
| November | 9 | 9 | 6 | 41 | 47 | 14 | 19 | 6 | 2 |
| December | 7 | 7 | 3 | 29 | 32 | 14 | 14 | 2 | 1 |
| January | 6 | 6 | 9 | 22 | 31 | 11 | 6 | 7 | 0 |
| February | 9 | 9 | 8 | 45 | 53 | 20 | 9 | 9 | 2 |
Splits Stats - Ball control per 40 min
| gp | off/40 | def/40 | reb/40 | ast/40 | to/40 | stl/40 | blk/40 | |
|---|---|---|---|---|---|---|---|---|
| Event | ||||||||
| Total | 31 | 1.2 | 6.5 | 7.7 | 2.8 | 2.3 | 1.1 | 0.2 |
| Conference | 22 | 1.3 | 5.8 | 7.1 | 2.7 | 1.5 | 1.4 | 0.2 |
| Exhibition | - | - | - | - | - | - | - | - |
| Location | ||||||||
| Home | 13 | 2.0 | 7.3 | 9.3 | 3.4 | 2.0 | 1.4 | 0.2 |
| Away | 12 | 0.6 | 5.7 | 6.3 | 2.3 | 1.7 | 0.9 | 0.2 |
| Neutral | 6 | 0.8 | 6.4 | 7.3 | 2.8 | 4.2 | 1.1 | 0.3 |
| Result | ||||||||
| Wins | 11 | 1.6 | 8.8 | 10.4 | 3.2 | 1.7 | 1.2 | 0.2 |
| Losses | 20 | 1.0 | 5.0 | 6.0 | 2.5 | 2.6 | 1.1 | 0.2 |
| Month | ||||||||
| November | 9 | 1.1 | 7.6 | 8.7 | 2.6 | 3.5 | 1.1 | 0.4 |
| December | 7 | 0.7 | 6.8 | 7.5 | 3.3 | 3.3 | 0.5 | 0.2 |
| January | 6 | 2.2 | 5.4 | 7.6 | 2.7 | 1.5 | 1.7 | 0.0 |
| February | 9 | 1.1 | 6.0 | 7.1 | 2.7 | 1.2 | 1.2 | 0.3 |
News Mentions
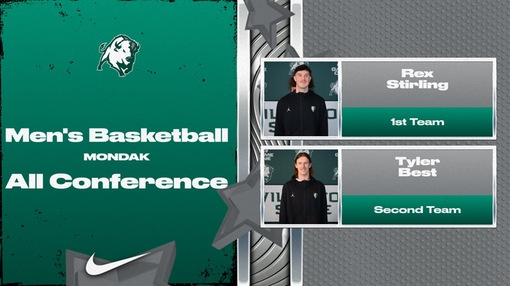
Men's Basketball announces postseason awards.
March 4, 2024

Men's Basketball ends their season with the loss to Bismarck State.
February 29, 2024
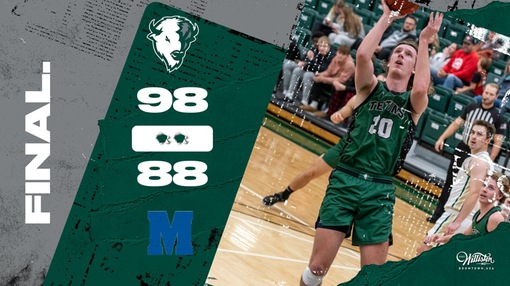
Men's Basketball wins 98-88 over MCC
February 12, 2024

Best earns MonDak "Player of the Week" honors
January 31, 2024
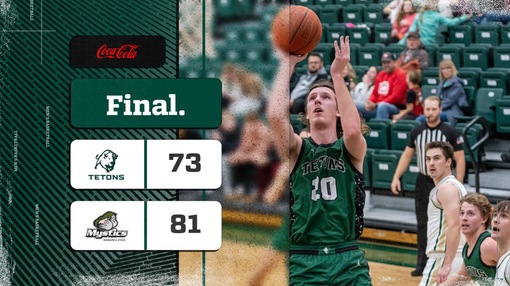
Men's Basketball falls to Bismarck State 73-81
January 18, 2024
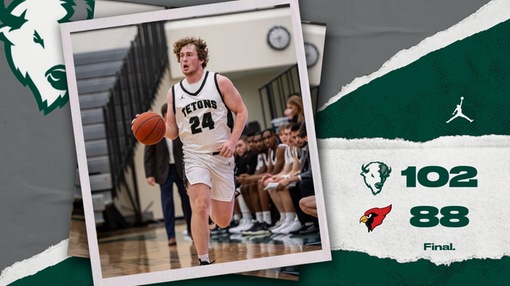
Men's Basketball wins 102-88 over Hibbing
November 18, 2023

Men's Basketball wins 89-86 over Miles Community College
November 4, 2023